As someone with a fascination for politics, markets, trends, and everything in between, this blog chapter was an interesting choice. While I’ve had more difficulty finding things that strike me as interesting in between all of the back home politics lately, the Italy story was certainly appealing. After all, while it’s rare that Italian politics and the possible ripple effect on markets can’t be a story, currently we’ve got one of those situations where all of the financial media is paying attention. So that weighed on my decision. But when it came down to it, the market dynamics often at work in the Crude Oil market won out. Perhaps an Italy chapter is not far behind, but for now, let’s talk oil…
I’ve told many people many times how unsuccessful I was as an automated, program driven crude oil trader. My work on trading algorithms often showed a great amount of success in every market…except oil. This was something I finally gave up on rectifying. The reason? I realized that crude did not lend itself well to my style of trading and model design; it was a market that spent more time in mean reversion and little in trends. For me as a trend follower, success would obviously be limited.
This is not to say crude oil doesn’t experience trends. It absolutely does. It’s a commodity after all; no commodity has a true shortage of trends. Nature, human psyche, etc., they all contribute to trends and cycles that have been successfully observed, interpreted and traded on for decades. Lots of decades. But then why the lack of success in crude oil trading? It’s because, as far as I can tell, crude spends much less “time” in trends. While time is in quotes, it really is time in the classic sense of the word. When crude has a large move, it is generally short lived, and often violent.
It goes up hard, it comes down hard. But in between? A lot of sideways. So this was not a market I was going to have long term success in. While a bunch of money could be made in each of those large trend moves, the periods in between would erode all of the profits, and in my personal models, even a bit more. Which brings us to now.
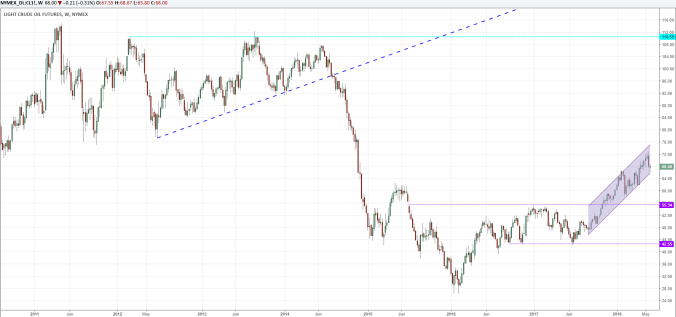
The crude chart above makes this pretty clear. At the top, we’ve got an ascending triangle. I’ve taught this pattern many times, and generally as it’s forming, one would have bullish thoughts. However(!), the reason we use these charts is to let the market dictate our actions as opposed to telling the market what it’s “supposed” to do. In this case, that level top stayed in place and we broke to the down side. The market didn’t look back and hasn’t since. However, paying attention to that break certainly made the direction of the market clear.
What it didn’t make clear was the degree and speed of the drop. This is not unusual behavior in this market. What I believe sets it apart from other markets is the swiftness of the trend beginning and ending. Yes this happens elsewhere at times, but it seems to be the way crude likes to move in general. And then it meanders to some extent. And that’s pretty much what it did for two years after making the ultimate low in 2016.
Where are we now? Inside a nice ascending channel bound by rising trendlines. What could go wrong? Mean Reversion, that’s what. The time this market spends trending next to the time it spends moving sideways will always weigh on my mind whenever I want to jump on the crude trend train. Usually by the time I jump on, it’s on the way to the last stop. This is not merely a psychological weakness, or even bad luck, it’s a market dynamic. So I’m wary…
It’s a tough spot to be in, and this is why we always look at the charts. Because while the dynamic of the crude market may make it difficult for me to program a winning trading model, it’s not something that is hiding anywhere but plain site. And it’s my own knee jerk reaction, “Crude is a mean reverting market,” that can stand in the way of profits when the trading decisions are not machine driven. These pictures may mess around at times, but they rarely lie. And that, if you’ve been searching, is the point and the lesson in this blog chapter; even if you’ve seen it “all” before, keep an open mind as the market progresses and the chart builds.
Keep in mind when making a “Plan” (always have a plan) that just like boring steady profits, boring markets aren’t all bad. If you’re a ‘quant,’ or even a ‘quant wannabe,’ you look forward to mean reversion. You bank on mean reversion…literally. So this market has something for everyone! And while all markets go through stages, up, down or sideways, crude’s stages are a bit different. Interest rates trend for years. Grains can trend multiple times in one year. But crude is where I’ve found the largest amount of sideways movement. And in this case, not a bad thing due to that level of predictability.
I’ve stated before that interest rates trend for years. And that predictability is good, given that so many of our long term decisions are interest rate based, or at least related. How is the economy doing overall? When should I shop for a house? All of these things relate not only to present, but to the future as well. Oil? Except for airlines, most people aren’t making long term decisions based on the pump. Short term? Sure. Should we fly or take a short road trip. It’s nothing like a 30 year mortgage commitment.
So we have opportunity. Opportunity to ride the trend, and opportunity to make ‘boring’ money with mean reversion. Sounds like a great market to trade! As long as you’re not trending when it’s sideways, or sideways when it’s trending. Be alert, be nimble, but mostly, “Pay Attention!” On second thought, that sounds like pretty good advice no matter what market you’re trading.
